
Employment Blog April 2016
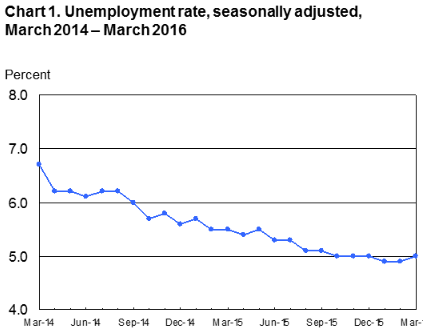
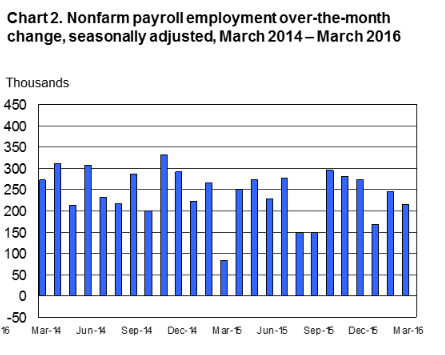
This Employment report is taken from the US Department of Labor, Bureau of Labor Statistics. Nonfarm payroll employment increased by 215,000 in March, and the unemployment rate was little changed at 5.0 percent. Job growth occurred in retail trade, construction, and health care. Employment fell in manufacturing and mining. Incorporating revisions for January and February, which reduced nonfarm payroll employment by 1,000 on net, monthly job gains have averaged 209,000 over the past 3 months. In the 12 months prior to March, employment growth averaged 223,000 per month. This information is summarized in Charts 1 and 2.
In March, retail trade employment rose by 48,000. Job growth occurred in general merchandise stores (+12,000), health and personal care stores (+10,000), building material and garden supply stores (+10,000), and auto dealers (+5,000). Over the year, retail trade has added 378,000 jobs.
Employment in construction rose by 37,000 over the month and is up by 301,000 over the year. Residential specialty trade contractors continued to add jobs in March (+12,000). Employment in this industry has risen by 135,000 over the year, representing almost half of the job growth in construction. Elsewhere in construction, employment in heavy and civil engineering construction increased by 11,000 over the month.
Health care employment rose by 37,000 in March. Both ambulatory health care services (+27,000) and hospitals (+10,000) added jobs. Over the year, health care employment has increased by 503,000. Over the month, employment continued to trend up in food services and drinking places (+25,000) and in financial activities (+15,000).
In March, employment in professional and business services changed little for the third month in a row. In 2015, the industry added an average of 52,000 jobs per month. Within the industry, employment in professional and technical services continued to trend up over the month (+14,000). Temporary help services employment has shown little change in recent months.
Manufacturing employment fell by 29,000 in March. Job losses were concentrated in durable goods manufacturing industries, including machinery (-7,000), primary metals (-3,000), and semiconductors and electronic components (-3,000). Since reaching a recent employment peak in March 2015, durable goods manufacturing has lost 68,000 jobs.
Employment in mining declined by 12,000 in March, primarily in support activities for mining (-10,000). Since a recent peak in September 2014, mining employment has fallen by 185,000. More than three-fourths of the job losses over this period have been in support activities for mining.
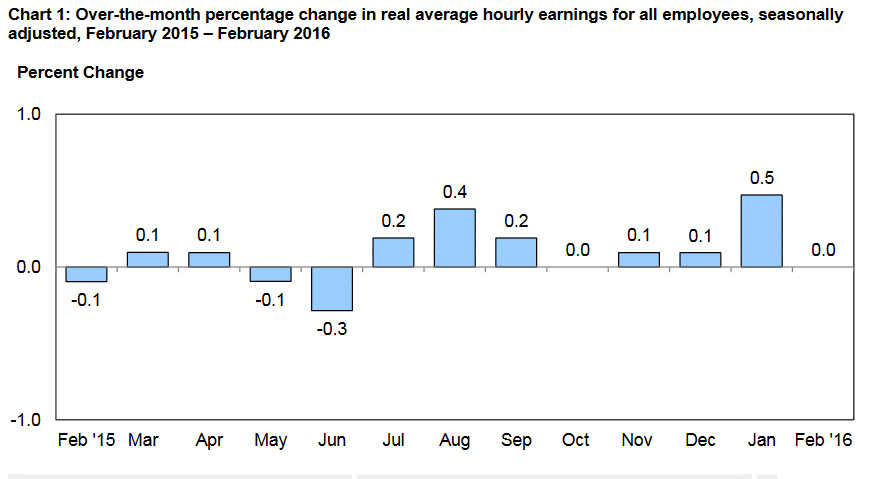
Average hourly earnings of all employees on private nonfarm payrolls rose by 7 cents in March to $25.43. Over the past 12 months, average hourly earnings have risen by 2.3 percent. From February 2015 to February 2016, the Consumer Price Index for All Urban Consumers (CPI-U) increased by 1.0 percent (on a seasonally adjusted basis).
Real average hourly earnings increased 1.2 percent, seasonally adjusted, from February 2015 to February 2016. This increase in real average hourly earnings, combined with a 0.6-percent decrease in the average workweek, resulted in a 0.6-percent increase in real average weekly earnings over this period. This information is detailed in Chart 1 below.
About Jim Hill
Meet Steve Singer, President and Owner of Employment Skip Tracing in a quick introductory video of our services. Our goal is simple. We make it easy for you to get the highest possible hit rates.