
Employment Blog February 2016
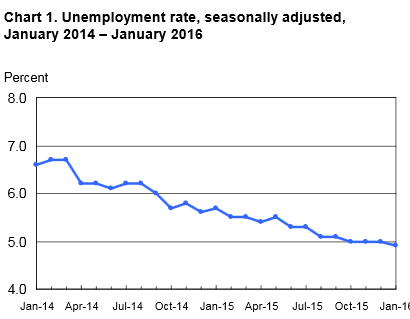
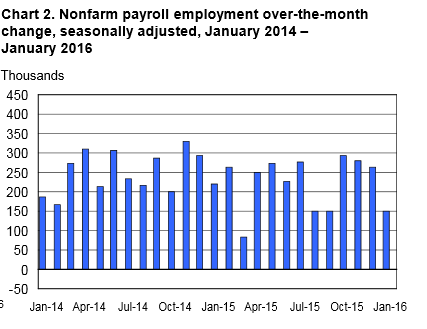
This employment report is from the Bureau of Labor Statistics, U S Department of Labor. Nonfarm payroll employment rose by 151,000 in January, and the unemployment rate, at 4.9 percent, changed little. Job growth occurred in several industries, including retail trade, food services and drinking places, health care, and manufacturing. Employment declined in private educational services, transportation and warehousing, and mining. After incorporating revisions that decreased total nonfarm employment by 2,000, on net, for November and December combined (including the impact of the annual benchmark process), monthly job gains have averaged 231,000 over the past 3 months. In 2015, employment growth averaged 228,000 per month. This is summarized in Charts 1 and 2 below.
Retail trade added 58,000 jobs in January, following essentially no change in December (-1,000). In January, there were job gains in general merchandise stores (+15,000), electronics and appliance stores (+9,000), motor vehicle and parts dealers (+8,000), and furniture and home furnishings stores (+7,000). Employment in retail trade has increased by 301,000 over the past 12 months, with motor vehicle and parts dealers and general merchandise stores accounting for nearly half of the gain.
Employment in food services and drinking places rose by 47,000 in January. Over the past 12 months, the industry has added 384,000 jobs.
Employment in health care increased by 37,000 in January, led by a gain of 24,000 in hospitals. Hospitals have added 258,000 jobs since a recent low in January 2014, with nearly three-fourths of the gain occurring in the last year.
Employment in manufacturing rose by 29,000 in January, following little change in 2015. Job gains occurred in food manufacturing (+11,000), fabricated metal products (+7,000), and furniture and related products (+3,000).
The financial activities industry added 18,000 jobs in January. Within the industry, employment in credit intermediation and related activities increased by 7,000. Over the year, financial activities added 149,000 jobs.
Employment in professional and business services changed little in January (+9,000), after increasing by 60,000 in December. Within the industry, professional and technical services added 25,000 jobs over the month, in line with recent job growth. Employment in temporary help services edged lower in January (-25,000), after edging up by the same amount in December. Private educational services lost 39,000 jobs in January, as seasonal layoffs were larger than usual.
Employment in transportation and warehousing decreased by 20,000 in January. Most of the job loss occurred among couriers and messengers (-14,000), reflecting larger than usual layoffs following strong seasonal hiring in the prior 2 months.
Mining employment continued to decline in January (-7,000). Since a recent peak in September 2014, employment in the industry has decreased by 146,000, or 17 percent. About three-fourths of the job losses over this period have been in support activities for mining.
Average hourly earnings of all employees on private nonfarm payrolls rose by 12 cents in January to $25.39. Over the past 12 months, average hourly earnings have rsen by 2.5 percent. From December 2014 to December 2015, the Consumer Price Index for all Urban Consumers (CPI-U) was up by 0.7 percentage point (on a seasonally adjusted basis).
Turning now to data from the household survey, both the unemployment rate, at 4.9 percent in January, and the number of unemployed persons, at 7.8 million, changed little over the month. These measures were down by 0.8 percentage point and 1.1 4 million, respectively, over the year. Among the unemployed, 2.1 million, or 26.9 percent, had been unemployed for 27 weeks or more.
The labor force participation rate, at 62.7 percent, was little changed over the month. The employment-population ratio, at 59.6 percent, also changed little in January, but was up by 0.3 percentage point since October.
Among the employed, the number working part time for economic reasons, also referred to as involuntary part-time workers, was little changed in January at 6.0 million. The number of these workers was down by 796,000 over the past year. (Involuntary part-time workers are those who would have preferred full-time employment but were working part time because their hours had been cut back or because they were unable to find full-time work.)
Among people who were neither working nor looking for work in January, 2.1 million were classified as marginally attached to the labor force, little different from a year earlier. The number of discouraged workers, a subset of the marginally attached who believed that no jobs were available for them, was 623,000 in January, also little changed from a year earlier.
About Jim Hill
Meet Steve Singer, President and Owner of Employment Skip Tracing in a quick introductory video of our services. Our goal is simple. We make it easy for you to get the highest possible hit rates.