May 2013 Employment Trends
 May Employment Trends (Information from U S Department of Labor, Bureau of Labor Statistics)
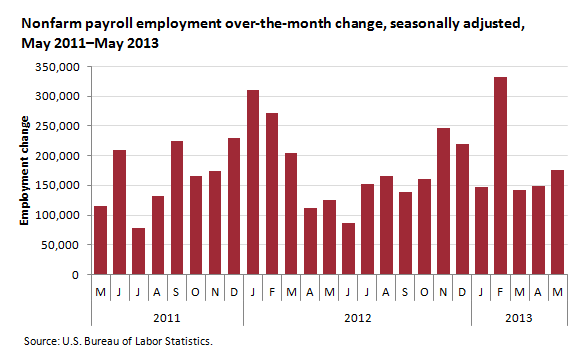
Total nonfarm payroll employment increased by 175,000 in May, with gains in professional and business services, food services and drinking places, and retail trade. Over the prior 12 months, employment growth averaged 172,000 per month. Professional and business services added 57,000 jobs in May. Within this industry,employment continued to trend up in temporary help services (+26,000), computer systems design and related services (+6,000), and architectural and engineering services (+5,000). Employment in professional and business services has grown by 589,000 over the past year. Within leisure and hospitality, employment in food services and drinking places continued to expand, increasing by 38,000 in May and by 337,000 over the past year. Retail trade employment increased by 28,000 in May. The industry added an average of 20,000 jobs per month over the prior 12 months. In May, general merchandise stores continued to add jobs (+10,000). Health care employment continued to trend up in May (+11,000). Job gains in home health care services (+7,000) and outpatient care centers (+4,000) more than offset a loss in hospitals (-6,000). Over the prior 12 months, job growth in health care averaged 24,000 per month. Within government, federal government employment declined by 14,000 in May. Over the past 3 months, federal government employment has decreased by 45,000. Employment in other major industries, including mining and logging, construction, manufacturing, wholesale trade, transportation and warehousing, and financial activities, showed little or no change over the month.
|
ESTABLISHMENT DATA |
||||
|
Category |
May |
Mar. |
Apr. |
May |
| EMPLOYMENT BY SELECTED INDUSTRY (Over-the-month change, in thousands) |
||||
| Total nonfarm |
125 |
142 |
149 |
175 |
| Total private |
152 |
154 |
157 |
178 |
| Goods-producing |
-12 |
14 |
-15 |
-1 |
| Mining and logging |
3 |
2 |
-4 |
0 |
| Construction |
-21 |
16 |
-2 |
7 |
| Manufacturing |
6 |
-4 |
-9 |
-8 |
| Durable goods(1) |
7 |
1 |
-2 |
-2 |
| Motor vehicles and parts |
3.8 |
2.8 |
-2.7 |
2.4 |
| Nondurable goods |
-1 |
-5 |
-7 |
-6 |
| Private service-providing(1) |
164 |
140 |
172 |
179 |
| Wholesale trade |
12.7 |
3.4 |
3.9 |
7.9 |
| Retail trade |
9.4 |
-2.8 |
19.9 |
27.7 |
| Transportation and warehousing |
30.3 |
-4.1 |
5.9 |
-3.9 |
| Information |
2 |
3 |
-7 |
3 |
| Financial activities |
14 |
6 |
9 |
4 |
| Professional and business services(1) |
37 |
59 |
60 |
57 |
| Temporary help services |
13.4 |
19.5 |
26.4 |
25.6 |
| Education and health services(1) |
47 |
48 |
37 |
26 |
| Health care and social assistance |
36.6 |
24.7 |
32.3 |
11.8 |
| Leisure and hospitality |
4 |
31 |
39 |
43 |
| Other services |
6 |
-3 |
3 |
13 |
| Government |
-27 |
-12 |
-8 |
-3 |
