Employment Blog August 2017
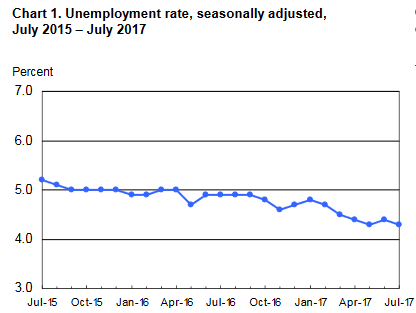
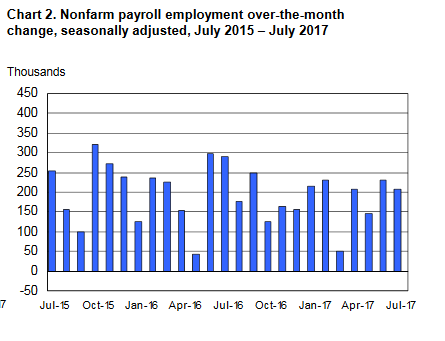
This information is from the U S Department of Labor, Bureau of Labor Statistics. Nonfarm payroll employment rose by 209,000 in July, and the unemployment rate, at 4.3 percent, was little changed. Job gains occurred in food services and drinking places, professional and business services, and health care. Employment growth has averaged 184,000 per month thus far this year, in line with the average monthly gain in 2016 (+187,000). This information is detailed in Charts 1 and 2 below.
In July, employment in food services and drinking places rose by 53,000. The industry has added 313,000 jobs over the year.
Professional and business services added 49,000 jobs in July. Thus far this year, monthly job gains in the industry have averaged 47,000, in line with average monthly employment growth in 2016 (+45,000).
Health care employment grew by 39,000 over the month. Job gains occurred in ambulatory health care services (+30,000) and hospitals (+7,000). Over the past year, health care has added 327,000 jobs.
Mining employment was essentially unchanged in July. From its recent low in October 2016 through June, the industry had added an average of 7,000 jobs per month.
Employment in other major industries–construction, manufacturing, wholesale trade, retail trade, transportation and warehousing, information, financial activities, and government–showed little change over the month.
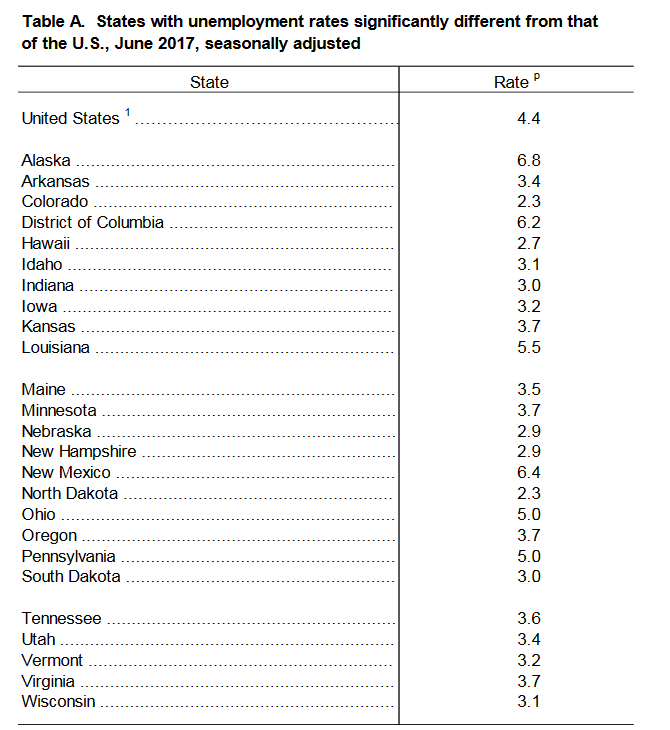
Unemployment rates were lower in June in 10 states, higher in 2 states, and stable in 38 states and the District of Columbia, the U.S. Bureau of Labor Statistics reported today. Twenty-seven states had jobless rate decreases from a year earlier and 23 states and the District had little or no change. The national unemployment rate, 4.4 percent, was little changed from May but was 0.5 percentage point lower than in June 2016.
Nonfarm payroll employment increased in 14 states in June 2017 and was essentially unchanged in 36 states and the District of Columbia. Over the year, 33 states added nonfarm payroll jobs and 17 states and the District were essentially unchanged.
Colorado and North Dakota had the lowest unemployment rates in June, 2.3 percent each. The rates in North Dakota (2.3 percent) and Tennessee (3.6 percent) set new series lows. (All state series begin in 1976.) Alaska had the highest jobless rate, 6.8 percent, followed by New Mexico, 6.4 percent. In total, 19 states had unemployment rates lower than the U.S.figure of 4.4 percent, 5 states and the District of Columbia had higher rates, and 26 states had rates that were not appreciably different from that of the nation. See table 1 below. 


