
Employment Blog August 2016
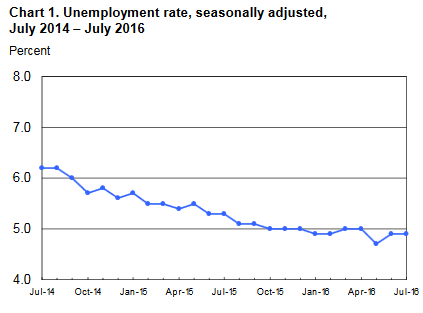
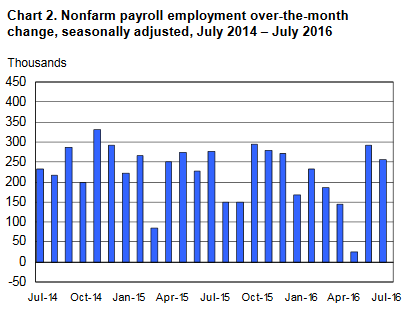
This report is from the U S Department of Labor Bureau of Labor Statistics. Nonfarm payroll employment rose by 255,000 in July,and the unemployment rate was unchanged at 4.9 percent. Job gains occurred in professional and business services, health care, and financial activities. Employment in mining continued to trend down. Incorporating revisions for May and June, which increased nonfarm payroll employment by 18,000, monthly job gains have averaged 190,000 over the past 3 months. In the 12 months prior to July, employment growth averaged 206,000 per month. This information is summarized in Charts 1 and 2 below.
Employment in professional and business services rose by 70,000 in July, and has risen by 550,000 over the year. Within the industry, job gains occurred over the month in computer systems design and related services (+8,000) and architectural and engineering services (+7,000). Employment also continued to trend up in management and technical consulting services (+6,000).
Health care added 43,000 jobs in July, with gains in ambulatory health care services (+19,000), hospitals (+17,000), and nursing and residential care facilities (+7,000). Over the past 12 months, health care employment has grown by 477,000.
Employment in financial activities rose by 18,000 in July. Over the year, this industry has added 162,000 jobs.
Leisure and hospitality employment continued to trend up in July (+45,000). Within the industry, employment in food services and drinking places changed little (+21,000). Thus far this year, food services has added an average of 18,000 jobs per month, compared with an average of 30,000 per month in 2015.
Employment in government edged up in July (+38,000).
Mining employment continued to trend down in July (-6,000), and has declined by 220,000 since its recent peak in September 2014. Three-fourths of the job losses since the peak have been in support activities for mining.
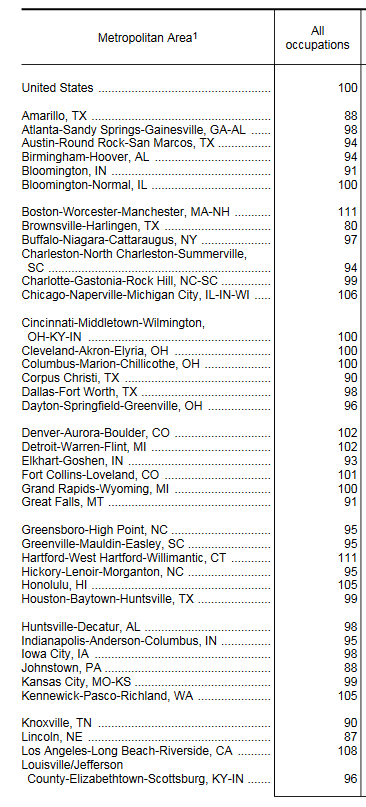
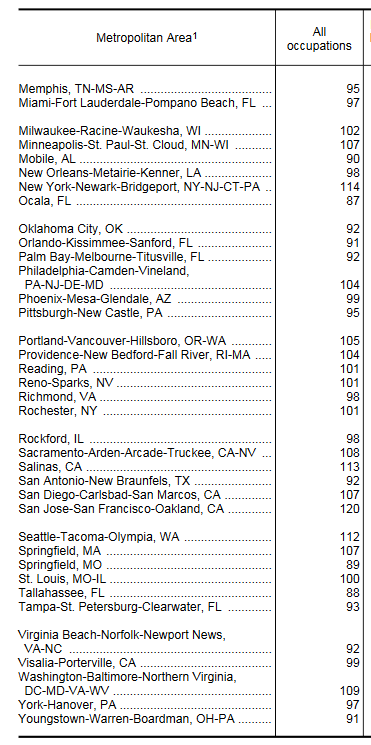
Using data from the National Compensation Survey (NCS), Bureau of Labor Statistics has provided pay relatives—a means of assessing pay differences—are available for each of the nine major occupational groups within surveyed metropolitan areas, as well as averaged across all occupations for each area. The average pay relative nationally for all occupations and for each occupational group equals 100. A pay relative is a calculation of pay—wages, salaries, commissions, and production bonuses—for a given metropolitan area relative to the nation as a whole. The calculation controls for differences among areas in occupational composition, establishment and occupational characteristics, and the fact that data are collected for areas at different times during the year. Simple pay comparisons calculating the ratio of the average pay for an area to the entire United States in percentage terms would not control for interarea differences in occupational composition and other factors, which may impact pay relatives. This information is presented in Tables 1a and 1b below.
About Jim Hill
Meet Steve Singer, President and Owner of Employment Skip Tracing in a quick introductory video of our services. Our goal is simple. We make it easy for you to get the highest possible hit rates.