
Employment Blog July 2016
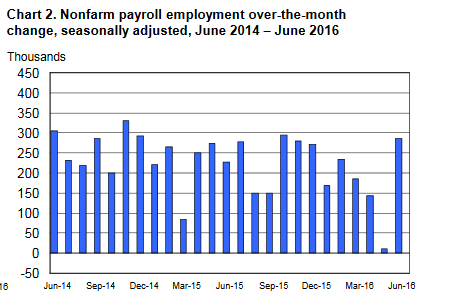
This report is taken from the U S Department of Labor, Bureau of Labor Statistics. Nonfarm payroll employment increased by 287,000 in June, after changing little in May (+11,000). The unemployment rate rose to 4.9 percent in June. Job gains occurred in leisure and hospitality, health care and social assistance, and financial activities. Employment in information also increased, largely due to the return of workers from a strike. Incorporating revisions for April and May, which reduced nonfarm payroll employment by 6,000 on net, monthly job gains have averaged 147,000 over the past 3 months. In the 12 months prior to June, employment growth averaged 199,000 per month. These results are summarized in Charts 1 and 2 below.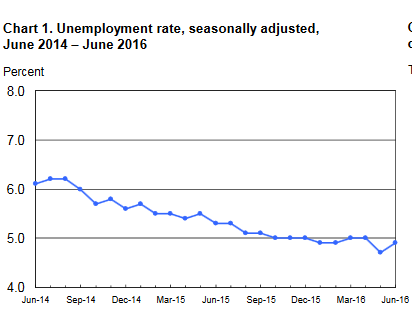
In June, employment in leisure and hospitality rose by 59,000, after changing little in the prior month. Employment rose in performing arts and spectator sports in June (+14,000), after edging down in May. Employment changed little in food services and drinking places in June (+22,000). Job gains in leisure and hospitality have averaged 27,000 per month in the first half of the year, down from an average of 37,000 per month in 2015, reflecting slower job growth in food services and drinking places.
Employment in health care and social assistance increased by 58,000 in June. Health care added 39,000 jobs over the month, with gains in ambulatory health care services (+19,000) and hospitals (+15,000). Within social assistance, child day care services added 15,000 jobs.
Employment in financial activities grew by 16,000 in June, in line with recent job growth in the industry. Information employment rose by 44,000 in June. Employment rose in telecommunications (+28,000), largely reflecting the return of workers from a strike. Motion picture and sound recording industries added 11,000 jobs over the month, following a loss of similar magnitude in May.
Employment in professional and business services continued to trend up in June (+38,000). Thus far this year, the industry has added an average of 30,000 jobs per month, compared with an average monthly gain of 52,000 in 2015.
Retail trade employment edged up by 30,000 in June, following 2 months of essentially no employment growth. In June, job gains occurred in general merchandise stores (+9,000) and in health and personal care stores (+5,000). Employment in retail trade has increased by 313,000 over the year.
Mining employment continued to trend down in June (-6,000). The industry has lost 211,000 jobs since the recent peak in September 2014. Three-fourths of the job losses over this period have been in support activities for mining.
Average hourly earnings of all employees on private nonfarm payrolls edged up by 2 cents in June to $25.61. Over the past 12 months, average hourly earnings have risen by 2.6 percent. From May 2015 to May 2016, the Consumer Price Index for All Urban Consumers (CPI-U) increased by 1.1 percent (on a seasonally adjusted basis).
Turning now to data from our survey of households, the number of unemployed persons rose by 347,000 to 7.8 million in June, and the unemployment rate increased by 0.2 percentage point to 4.9 percent. These increases largely offset declines in the prior month, and bring both measures back in line with levels that had prevailed since August 2015. The number of long-term unemployed–those who had been looking for work for 27 weeks or more–changed little in June, at 2.0 million. These individuals accounted for 25.8 percent of the unemployed. Both the labor force participation rate (62.7 percent) and the employment-population ratio (59.6 percent) were little changed over the month. Among the employed, the number of individuals working part time for economic reasons declined by 587,000 to 5.8 million in June, offsetting an increase in the prior month. (These individuals, also referred to as involuntary part-time workers, would have preferred full-time employment but were working part time because their hours had been cut back or because they were unable to find full-time work.) Among people who were neither working nor looking for work in June, 1.8 million were classified as marginally attached to the labor force, little different than a year earlier. The number of discouraged workers, a subset of the marginally attached who believed that no jobs were available for them, was 502,000 in June, down by 151,000 from a year earlier. (The marginally attached are individuals who had not looked for work in the 4 weeks prior to the survey but wanted a job, were available for work, and had looked for a job within the last 12 months.)
Compensation costs for civilian workers increased 1.9 percent for the 12-month period ending in March 2016. In March 2015, compensation costs increased 2.6 percent. Wages and salaries increased 2.0 percent for the current 12-month period, and increased 2.6 percent for the 12-month period ending in March 2015. Benefit costs increased 1.7 percent for the 12-month period ending in March 2016. In March 2015, the increase was 2.7 percent. See Chart 4 below.

About Jim Hill
Meet Steve Singer, President and Owner of Employment Skip Tracing in a quick introductory video of our services. Our goal is simple. We make it easy for you to get the highest possible hit rates.