
Employment Blog December 2017
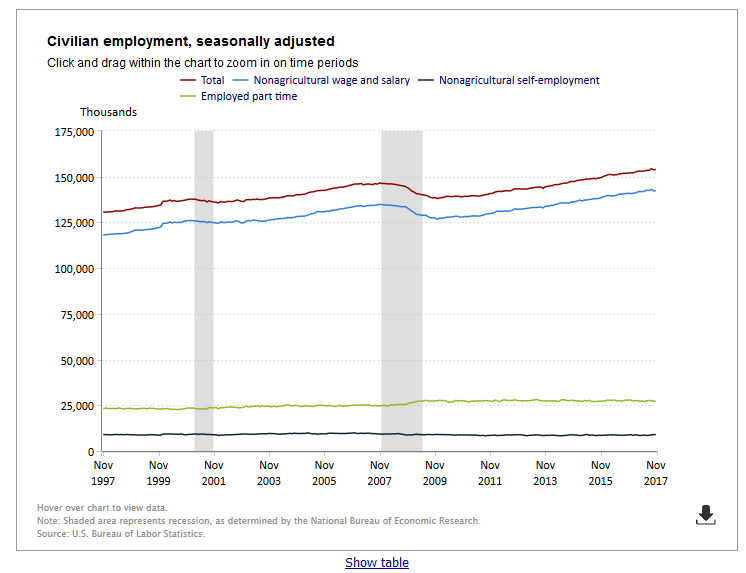
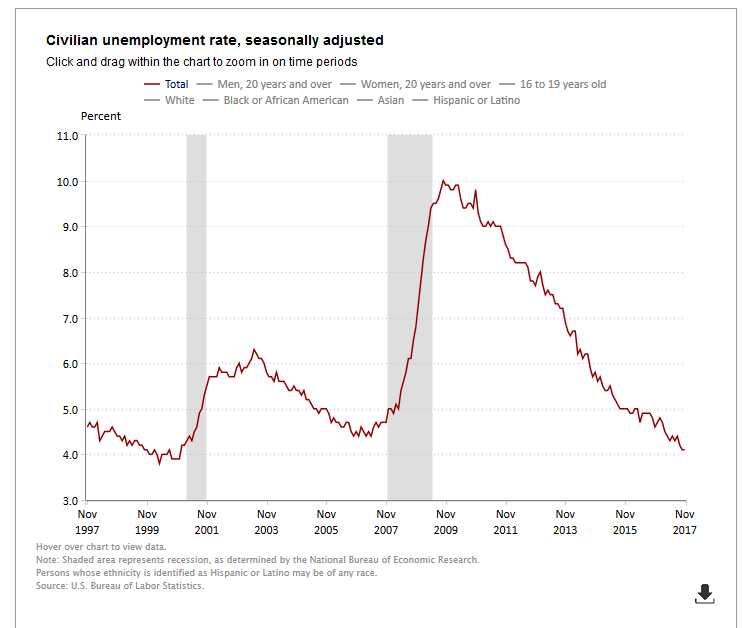
This employment blog is from the Bureau of Labor Statistics, U S Department of Labor. Nonfarm payroll employment increased by 228,000 in November, and the unemployment rate was unchanged at 4.1 percent. Employment continued to trend up in professional and business services, manufacturing, and health care. Employment growth has averaged 174,000 per month thus far this year, compared with an average monthly gain of 187,000 in 2016. Incorporating revisions for September and October, which increased nonfarm payroll employment by 3,000 on net, monthly job gains have averaged 170,000 over the past 3 months. This information is detailed in Charts 1 and 2 below.
In November, employment in professional and business services continued to trend up (+46,000). This is in line with the average monthly gain for the industry over the past 2 years.
Manufacturing added 31,000 jobs in November. Job gains occurred in machinery (+8,000), fabricated metal products (+7,000), computer and electronic products (+4,000), and plastics and rubber products (+4,000). Since a recent low in November 2016, manufacturing employment has expanded by 189,000.
Health care employment rose by 30,000 in November. Most of the gain occurred in ambulatory health care services (+25,000), which includes offices of physicians and outpatient care centers. Monthly job gains in health care have averaged 24,000 so far in 2017, compared with 32,000 in 2016.
Within construction, specialty trade contractors added 23,000 jobs over the month and 132,000 over the year. These gains were split about equally between residential and nonresidential contractors.
Employment in other major industries–mining, wholesale trade, retail trade, transportation and warehousing, information, financial activities, leisure and hospitality, and government–showed little change over the month.
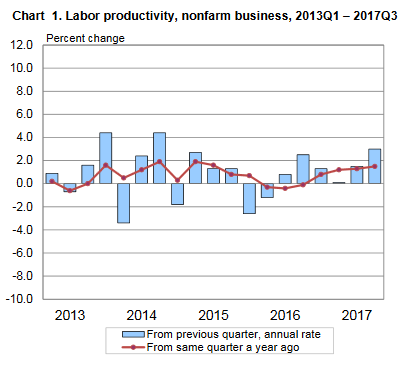
Nonfarm business sector labor productivity increased 3.0 percent during the third quarter of 2017, the U.S. Bureau of Labor Statistics reported today, as output increased 4.1 percent and hours worked increased 1.1 percent. The productivity increase was the largest since the third quarter of 2014, when output per hour increased 4.4 percent. (All quarterly percent changes in this release are seasonally adjusted annual rates.) From the third quarter of 2016 to the third quarter of 2017, productivity increased 1.5 percent, reflecting a 3.0-percent increase in output and a 1.5-percent increase in hours worked. Labor productivity, or output per hour, is calculated by dividing an index of real output by an index of hours worked by all persons, including employees, proprietors, and unpaid family workers. This information is detailed in Chart 3 below.
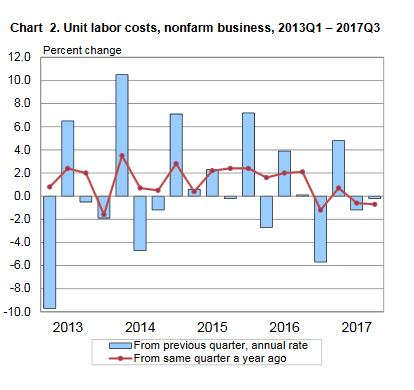
Unit labor costs in the nonfarm business sector declined 0.2 percent in the third quarter of 2017, as the 3.0-percent increase in productivity was greater than a 2.7 -percent increase in hourly compensation. Unit labor costs decreased 0. 7 percent over the last four quarters. (See chart 2 and tables A 1 and 2.) BLS calculates unit labor costs as the ratio of hourly compensation to labor productivity. Increases in hourly compensation tend to increase unit labor costs, and increases in output per hour tend to reduce them. This information is detailed in Chart 4 below.
About Jim Hill
Meet Steve Singer, President and Owner of Employment Skip Tracing in a quick introductory video of our services. Our goal is simple. We make it easy for you to get the highest possible hit rates.