
Employment Blog February 2018
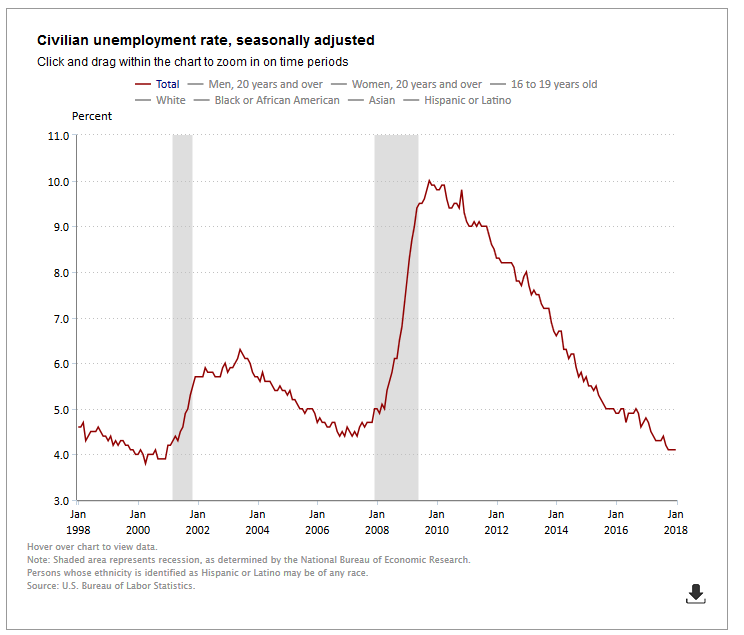
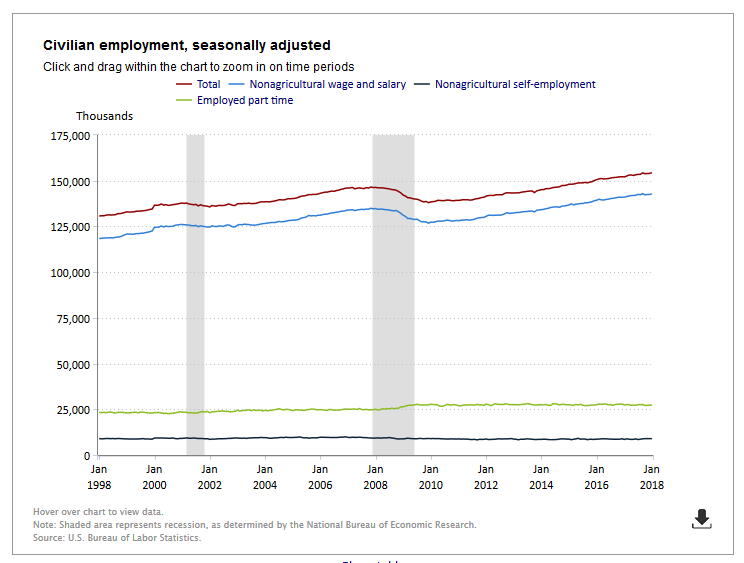
This report is from the US Department of Labor, Bureau of Labor Statistics. Nonfarm payroll employment rose by 200,000 in January, and the unemployment rate remained at 4.1 percent. Employment continued to trend up in construction, food services and drinking places, health care, and manufacturing. In 2017, employment growth averaged 181,000 per month. Incorporating revisions for November and December, which decreased nonfarm payroll employment by 24,000 on net, monthly job gains have averaged 192,000 over the past 3 months. This information is detailed in Charts 1 and 2 below.
Construction employment rose by 36,000 in January, with most of the increase occurring among specialty trade contractors (+26,000). The construction sector has added 226,000 jobs over the past 12 months.
Employment in food services and drinking places continued to trend up over the month (+31,000). The industry has added 255,000 jobs over the past 12 months.
Health care employment also continued to trend up in January (+21,000). Employment in hospitals rose by 13,000 over the month. Job growth in health care averaged 24,000 per month in 2017.
In January, manufacturing employment continued on an upward trend (+15,000). Manufacturing has added 186,000 jobs over the past 12 months. A large share of recent job gains occurred in the durable goods component, particularly in fabricated metal products, machinery, and computer and electronic products.
Employment in other major industries–mining, wholesale trade, retail trade, transportation and warehousing, information, financial activities, professional and business services, and government–changed little over the month.
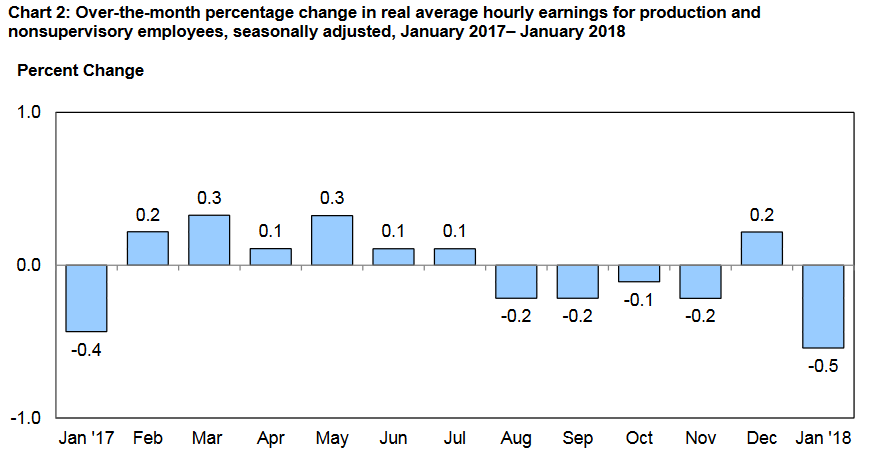
Production and nonsupervisory employees Real average hourly earnings for production and nonsupervisory employees decreased 0.5 percent from December to January , seasonally adjusted. This result stems from a 0.1-percent increase in average hourly earnings offset by a 0.6- percent increase in the Consumer Price Index for Urban Wage Earners and Clerical Workers (CPI-W). Real average weekly earnings decreased 0.8 percent over the month due to the decrease in real average hourly earnings combined with a 0.3-percent decrease in average weekly hours. This information is detailed in Chart 3 below.
About Jim Hill
Meet Steve Singer, President and Owner of Employment Skip Tracing in a quick introductory video of our services. Our goal is simple. We make it easy for you to get the highest possible hit rates.